Data Loading#
Once you know the products or datasets that you are interested in, you can load data using dc.load().
Loading Datasets#
One way to load data from a datacube is to pass a list of datasets to dc.load(). For example, we can load the ls9_sr datasets we found in the previous Data Searching example by passing them to dc.load()’s datasets parameter.
To load data for a subset of measurements, we can supply them to dc.load()’s measurements parameter (here we use the red, green, blue measurement alias names that we obtained in the Product Discovery example). For indexed datacube products, we also need to supply our desired output coordinate reference system (output_crs) and output resolution (resolution). Datacube will then resample and reproject our data to match these inputs.
[1]:
import datacube

dc = datacube.Datacube(app="my_analysis")

datasets = dc.find_datasets(
    product="ls9_sr",
    x=(29.0, 29.01),
    y=(25.0, 25.01),
    time=("2022-01-01", "2022-02-01"),
)

ds = dc.load(
    datasets=datasets,
    measurements=["red", "green", "blue"],
    output_crs="EPSG:6933",
    resolution=(-30, 30),
)
ds
[1]:
<xarray.Dataset>
Dimensions:      (time: 2, y: 8119, x: 7192)
Coordinates:
  * time         (time) datetime64[ns] 2022-01-15T08:31:52.404426 2022-01-31T...
  * y            (y) float64 3.16e+06 3.16e+06 3.16e+06 ... 2.917e+06 2.917e+06
  * x            (x) float64 2.684e+06 2.685e+06 2.685e+06 ... 2.9e+06 2.9e+06
    spatial_ref  int32 6933
Data variables:
    red          (time, y, x) uint16 0 0 0 0 0 0 0 0 0 0 ... 0 0 0 0 0 0 0 0 0 0
    green        (time, y, x) uint16 0 0 0 0 0 0 0 0 0 0 ... 0 0 0 0 0 0 0 0 0 0
    blue         (time, y, x) uint16 0 0 0 0 0 0 0 0 0 0 ... 0 0 0 0 0 0 0 0 0 0
Attributes:
    crs:           EPSG:6933
grid_mapping: spatial_refWe can see that dc.load has returned an xarray.Dataset containing data from our two input datasets. This xarray.Dataset includes:
Dimensions
This header identifies the number of timesteps returned
(time: 2)as well as the number of resulting pixels in thexandydirections.Coordinates
timeidentifies the time attributed to each returned timestep.
xandyprovide coordinates for each pixel within the returned data.
spatial_refprovides information about the spatial grid used to load the dataData variables
These are the measurements available for the loaded product. For every timestep (
time) returned by the query, the measured value at each pixel (y,x) is returned as an array for each measurement. Each data variable is itself anxarray.DataArrayobject.Attributes
Other important metadata or attributes for the loaded data
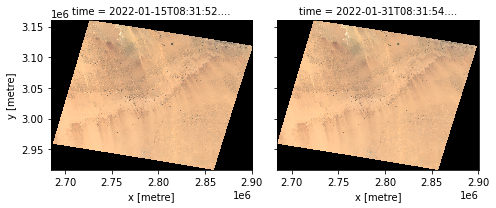
We can also inspect our loaded data by plotting it:
[2]:
ds[["red", "green", "blue"]].to_array().plot.imshow(col="time", robust=True)
[2]:
<xarray.plot.facetgrid.FacetGrid at 0x7fa8ba244310>
Querying and Loading#
We can see in the image above that dc.load() has loaded the entire input datasets, which for Landsat 9 includes the extent of a full satellite path-row scene.
Instead, we may prefer to load a subset of data for a specific spatial and temporal extent. To do this, we can query and load data directly with dc.load() without first searching for datasets using dc.find_datasets().
To achieve this, we can pass all the inputs we originally passed to dc.find_datasets() (e.g. product, x, y, time) to dc.load() instead:
[3]:
ds = dc.load(
    product="ls9_sr",
    x=(29.0, 29.1),
    y=(25.0, 25.1),
    time=("2022-01-01", "2022-02-01"),
    measurements=["red", "green", "blue"],
    output_crs="EPSG:6933",
    resolution=(-30, 30),
)
ds
[3]:
<xarray.Dataset>
Dimensions:      (time: 2, y: 388, x: 322)
Coordinates:
  * time         (time) datetime64[ns] 2022-01-15T08:31:52.404426 2022-01-31T...
  * y            (y) float64 3.103e+06 3.103e+06 ... 3.092e+06 3.092e+06
  * x            (x) float64 2.798e+06 2.798e+06 ... 2.808e+06 2.808e+06
    spatial_ref  int32 6933
Data variables:
    red          (time, y, x) uint16 22285 22517 22302 ... 21193 22230 20021
    green        (time, y, x) uint16 17701 17715 17627 ... 16897 17321 16152
    blue         (time, y, x) uint16 13124 13073 13038 ... 12580 12743 12352
Attributes:
    crs:           EPSG:6933
grid_mapping: spatial_refWe can see from Dimensions that a much smaller set of pixels have now been loaded compared to the previous time we called dc.load().
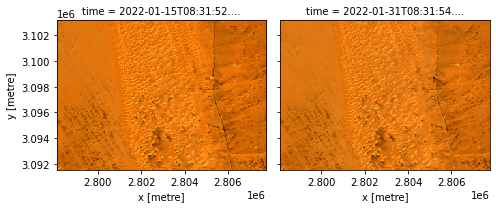
If we plot our new xarray.Dataset, we can see that dc.load() has now loaded data for only the specific x and y ranges we specified:
[4]:
ds[["red", "green", "blue"]].to_array().plot.imshow(col="time", robust=True)
[4]:
<xarray.plot.facetgrid.FacetGrid at 0x7fa88e4d4d00>